


examples of typical water treatment lines
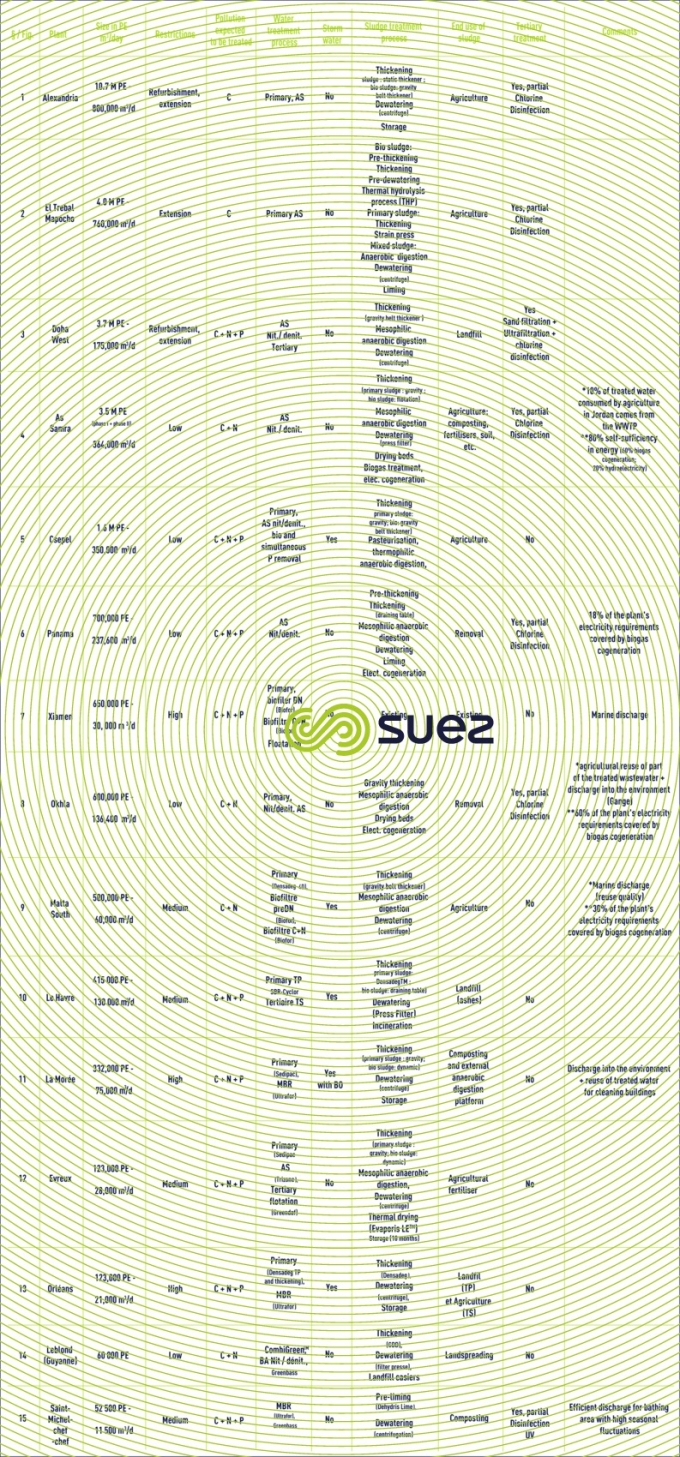
Reading time:The fifteen figures showing systems described in this sub-paragraph and summarised in table 10 illustrate the concepts presented in the previous two sections by briefly describing recent SUEZ projects with a size range between 50,000 and 10.7 million population equivalent; the targets to be achieved by these projects also have major differences:
- from the exclusive elimination of carbonaceous pollution to obtaining ultra pure water (make-up water for HP boilers);
- from plants subject to few environmental restrictions to plants that are part of the urban fabric.
Table 10 provides the relevant features of these plants whose system diagrams include:
- diagrams for the main stages of the water and sludge treatment lines together with the technologies selected from the Degrémont® range (note: for simplification purposes, returns from sludge treatment are not systematically shown);
- performances are those forecast/obtained from these plants;
- comments included beneath the figure draw the reader’s attention to the most interesting aspects of the plant described.
Note:
- values shown as “nominal” are those contractually applicable to the plant inlet and/or outlet;
- values shown as “forecast” are the most likely figures one can expect;
- values shown as “recorded” apply to results obtained and summarised as a mean value or a percentile fraction (shown as n % ile).

Bookmark tool
Click on the bookmark tool, highlight the last read paragraph to continue your reading later
