Temporary read-only version. The degremont® Water Handbook is temporarily available as a static website: account creation, login, search and bookmarks are unavailable.Temporary read-only version: account, search and bookmarks unavailable.

examples

Reading time:

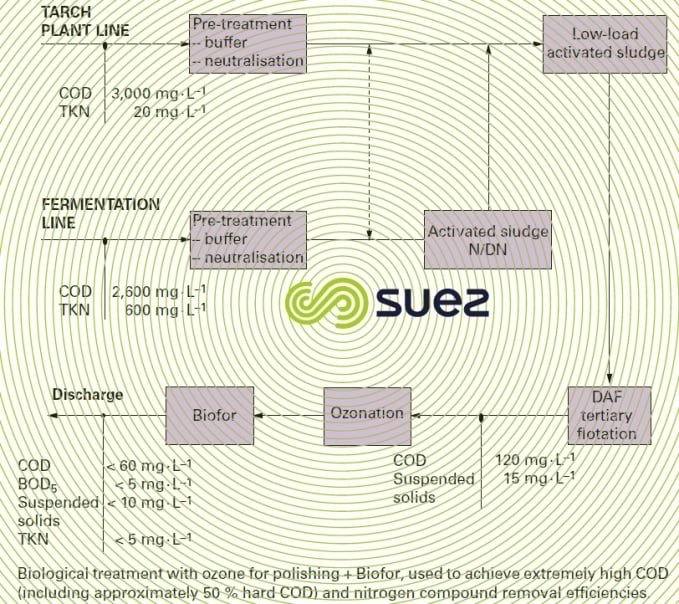
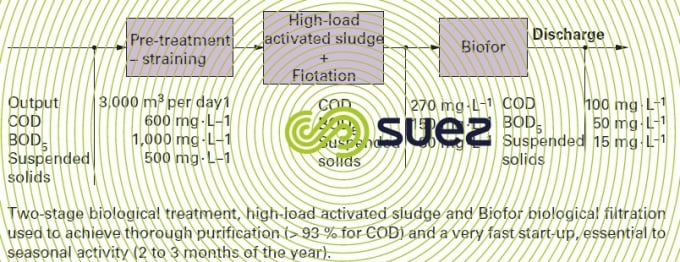
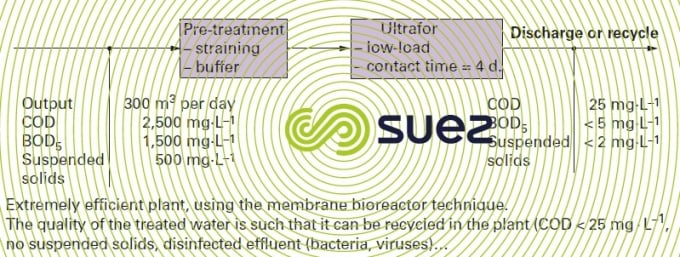
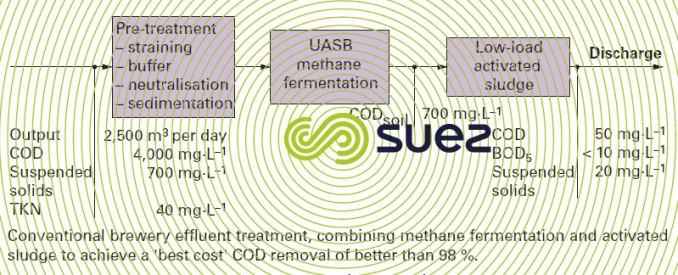
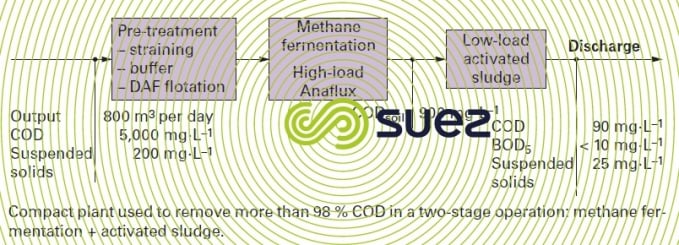
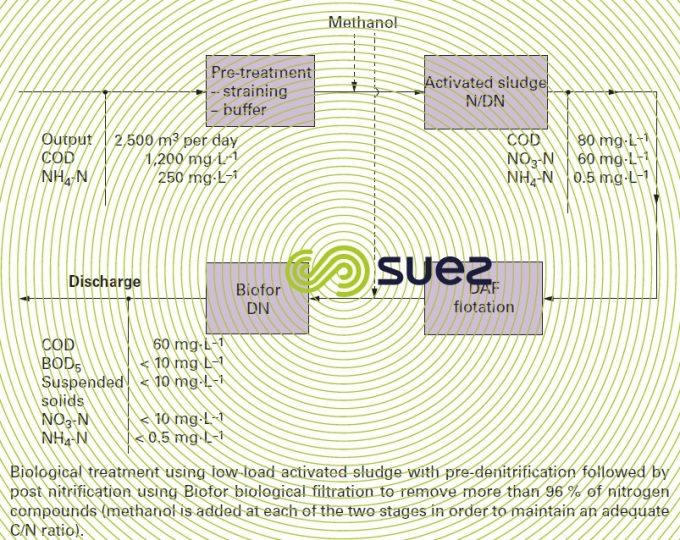
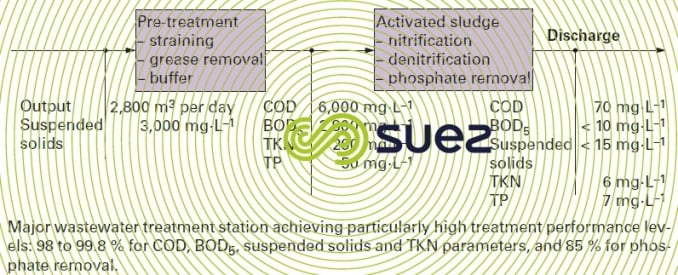
The seven figures below (figures 3 to 9) consist of diagrams taken from several SUEZ references. They illustrate the types of treatment systems used in these industries as well as the resulting effluent quality.

Starch - glucose
Figure 3. Starch/glucose plant: output 300 m3· h–1
flour mill – starch works - marquette-lez-Lille
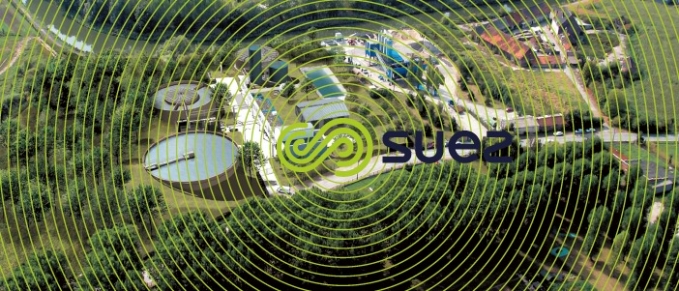
Photo 2. SI Lesaffre yeast works (flour mill – starch works) (Marquette-lez-Lille, France) – Output: 4,100 m3· d–1
Tomato canning - Spain
Figure 4. Tomato canning plant (Spain): 3,000 tons per day
dairy - Unigate - yogurt dairy desserts
Figure 5. Unigate – Dairy - LLO (France): 40,000 tons per year of yogurt and dairy desserts
Brewery – Central de Cervejas
Figure 6. Brewery – Central de Cervejas (Portugal): 3,000,000 hL per year
Soft drinks – Coca Cola
Figure 7. Soft drinks – Coca Cola (France)
Biotechnology – Biotalia – Lysine
Figure 8. Biotechnology – Biotalia – Lysine production plant (Italy): 22,000 tons per year
Bigard abattoirs
Figure 9. Bigard abattoirs: COD = 17 tons per day – TKN = 810 kg per day
read more :
Nitrification, Biofor, Ultrafor, Anaflux, Industrial effluent treatment, Agri-food industry, Pretreatments, Biological processes, Activated sludge, Methane fermentation, Phosphate removal, Denitrification, Flotation