


bioreactors
Reading time:suspended growth, attached growth processes
Bacterial cultures can be used in a number of different ways. By convention, we differentiate between suspended growth cultures and attached cultures.
In suspended growth processes,used in wastewater treatment, a bacterial culture is developed as a floc that is dispersed through the body of liquid to be treated. In order to maintain the culture in suspension, the tank has to be mixed.
In attached growthprocesses, we make use of the feature found in most micro-organisms that allows them to produce exopolymers that enable these micro-organisms to attach themselves to a wide range of substrates in order to form a biofilm. For a clearer understanding of the tables and statements made in the following, we have to define an intermediate category designated combined growth processes. Unlike the strictly attached growth processes where the support medium is immobile and where the liquid percolates along the length of the support medium, combined growths are attached to fairly fine and/or lightweight substrates so that they can be kept in suspension in the biological reactor in the same way as bacterial floc.
Attached, hybrid or suspended growth processes can be used for aerobic, anoxic or anaerobic treatments as summarised in table 2.


hydraulic characteristics of biological reactors
flow properties
Another important difference, especially in the case of suspended growth processes is the flow through the bioreactor. A bioreactor is said to be a complete-mix tank if concentration (biomass, substrate, oxygen...) and temperature are identical throughout the entire tank. In the ideal plug-flow reactor, any fluid element with its suspended solids is moved along the tank without mixing to any extent with associate elements of the fluid. The tank is likened to a structure having a high length/width ratio and, in this case, axial concentration gradients will appear.
The hydraulic contact time will theoretically be the same for all particles whereas, in a complete-mix reactor, particle contact time distribution will follow the Gaussian pattern.
These hydraulic properties are important because they impact on substrate concentrations in the different areas of the reactor and, therefore, on reaction kinetics; these hydraulic properties can even prioritise the development of certain bacteria species over others.
reaction kinetics
Theoretical considerations have demonstrated the following: in a structure of a given capacity, as soon as a reaction rises above zero, plug-flow must be such that the reactions progress better than would be the case for complete-mix or, given the same rate off reaction progress, a smaller structure capacity.
In fact, on an industrial scale, there are no bioreactors operating under complete-mix or ideal plug flow conditions. However, some reactors come close to this situation especially in complete-mix (vigorous agitation) and, less frequently, in plug-flow applications. A longitudinal dispersion coefficient is normally used to quantify this trend. A zero value applies to an ideal plug-flow, whereas an infinite value applies to ideal complete-mix.
hydraulic contact time distribution
If we call:
hct the theoretical contact time provided by


where V is the volume of the reactor and Q the through flow.
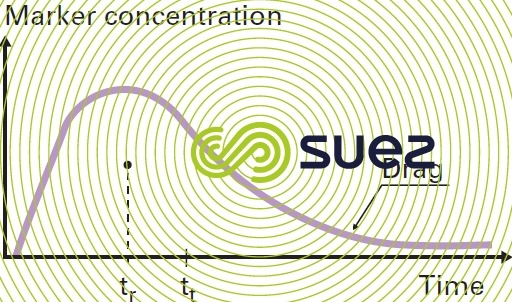
And if we calculate the actual contact time from the curve showing the response to an instantaneous injection of a marker, we can then deduce the average weighted time (tr) between inlet and outlet:
- if tr = hct and if the outlet is stepped, the reactor will be very close to the ideal plug flow;
- if tr = hct but if the outlet follows a classic Gaussian pattern, the reactor will be very close to complete-mix;
- if tr < hct, we have the significant dead zone index (area where mixing is unsatisfactory); there will also be a drag (figure 2);
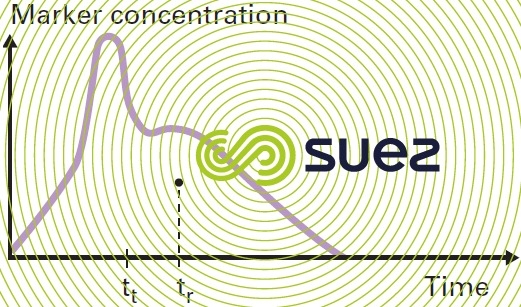
- if tr < hct but with a clear peak (figure 3), this indicates one or more short-circuits that will bring the substrate to the outlet far faster than expected.
There are software programmes that are used to analyse this type of curve and to establish (save in the case of extremely bad hydraulics), the number of complete-mix reactors which, coupled in series, provide the best simulation of the tank being tested.


Bookmark tool
Click on the bookmark tool, highlight the last read paragraph to continue your reading later
