


quantities to be processed
Reading time:wastewater
The volume of wastewater produced per inhabitant and per day tends to rise with the size of the urban centre due to different lifestyles and to a greater input from the secondary and tertiary sectors. This volume of wastewater will also vary depending on the area of the world concerned and on its level of development. It may be affected by the pricing structure applied to drinking water consumption.
Below 150 L·inhab–1·d–1 in many rural centres, the urban wastewater output in dry periods in France has now reached approximately 200 L·inhab–1·d–1, for towns numbering a few tens of thousands of inhabitants. It is higher than 300 L·inhab–1·d–1, in Paris (France) where large amounts of water are used for street washing. It is signficantly higher than 400 L·inhab–1·d–1in many American or Swiss towns. Water frequently sourced from small streams feeding individual mains together with poor maintenance: terrain drained via a system that is more or less piecemeal (see spurious water) has led to these ratios becoming inflated.
These situations are costly because water purification plant sizing will depend on the amount of pollution in the water treated and also on the hydraulic capacity of the plant concerned.
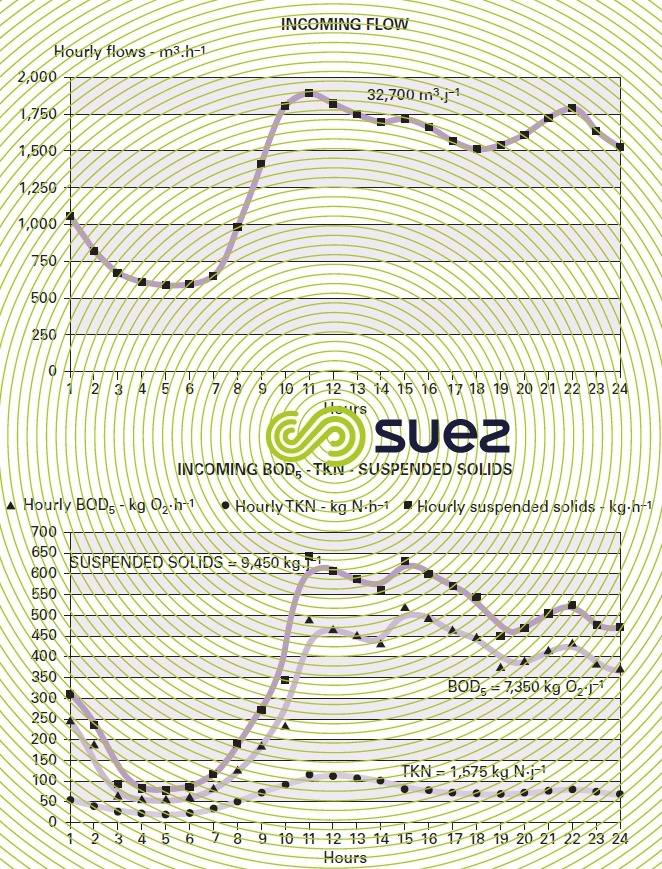
Urban wastewater output varies throughout the day. In the small centres, two output peaks are often recorded; however, there is only one peak in the larger urban centres. Sociological changes are tending towards the latter type of variation becoming more widespread (figure 20).
The shorter the network and the smaller the population it services, the higher the peak. When a network has many lifting units, this can have a comparable effect.
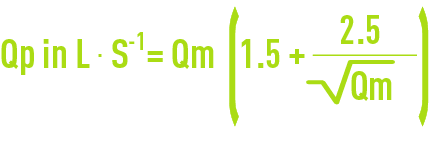
In general, it is true that pollution streams (see BOD, suspended solids, NK flows shown in figure 21) vary more widely than the output reflecting the fact that maximum concentration levels are achieved during the output peak.
Additionally, even when the curves appear to be identical, each type of pollution changes "autonomously" and, in the example quoted in figure 21 (extremely typical), each will have a different maximum stream/minimum stream ratio (table 29).


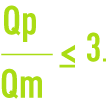
In many countries, dry periods are defined by an average daytime output Qm. If Qd is the daily output, Qm will most frequently range from:


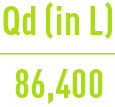
and a dry period peak output Qp. In a separate system, Qp can be approximated using the following equation:
where Qm = average daily output =
and within the limits of a peak coefficient :
Outside daily variations, we are seeing more and more major weekly (week-end) and even seasonal fluctuations in wastewater output and this extends to very large urban centres. These fluctuations are closely associated with holiday periods and reflect the significant exodus of city dwellers to summer or winter leisure centres.
storm water
Storm water flow depends on:
- the slope and area of the catchment basin;
- its impermeability coefficient;
- rainfall intensity.
Several formulae allowing for these parameters have been put forward and include the Caquot formula. An increasing number of modules is used not only to calculate flows generated by all or part of a catchment basin but also, in real time, to provide the same data from the actual rain depth measured by a rain gauge.
For European urban areas covering a few hundred hectares, the maximum 5-year run-off flow is equal to approximately 200 L·s–1·ha–1.
Bookmark tool
Click on the bookmark tool, highlight the last read paragraph to continue your reading later
