


characteristics solution constants
Reading time:specific gravities
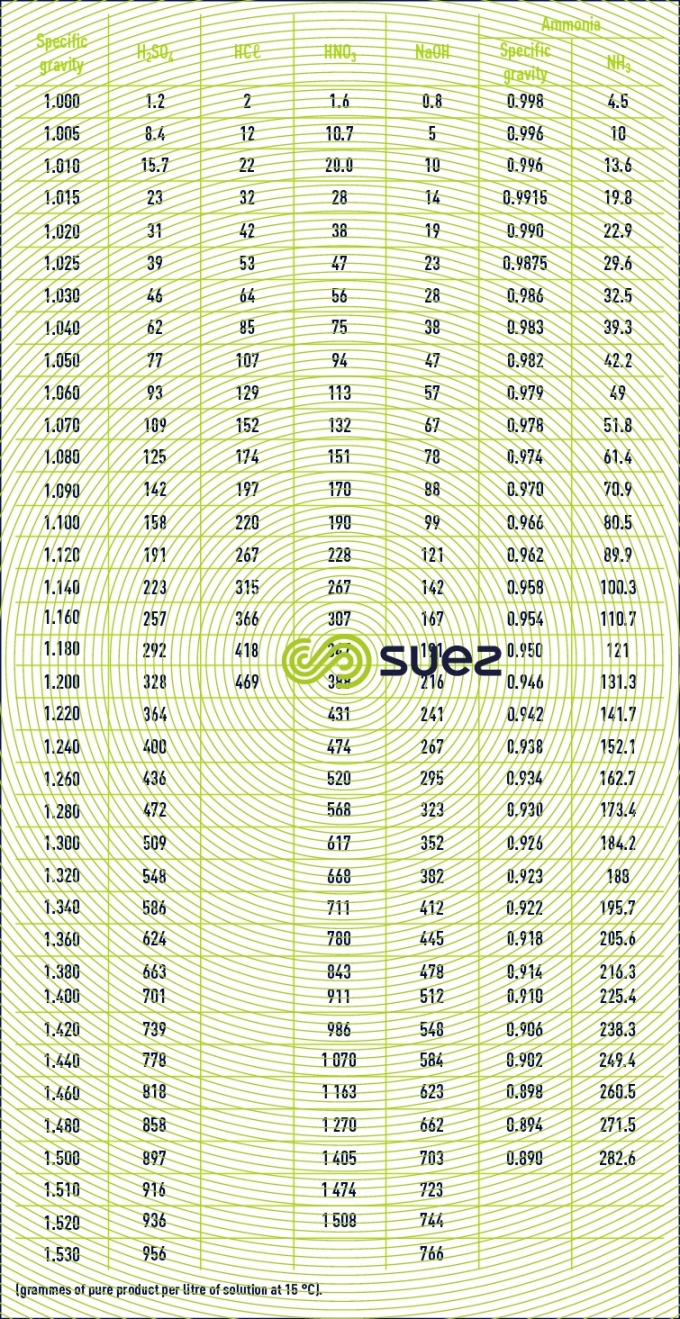

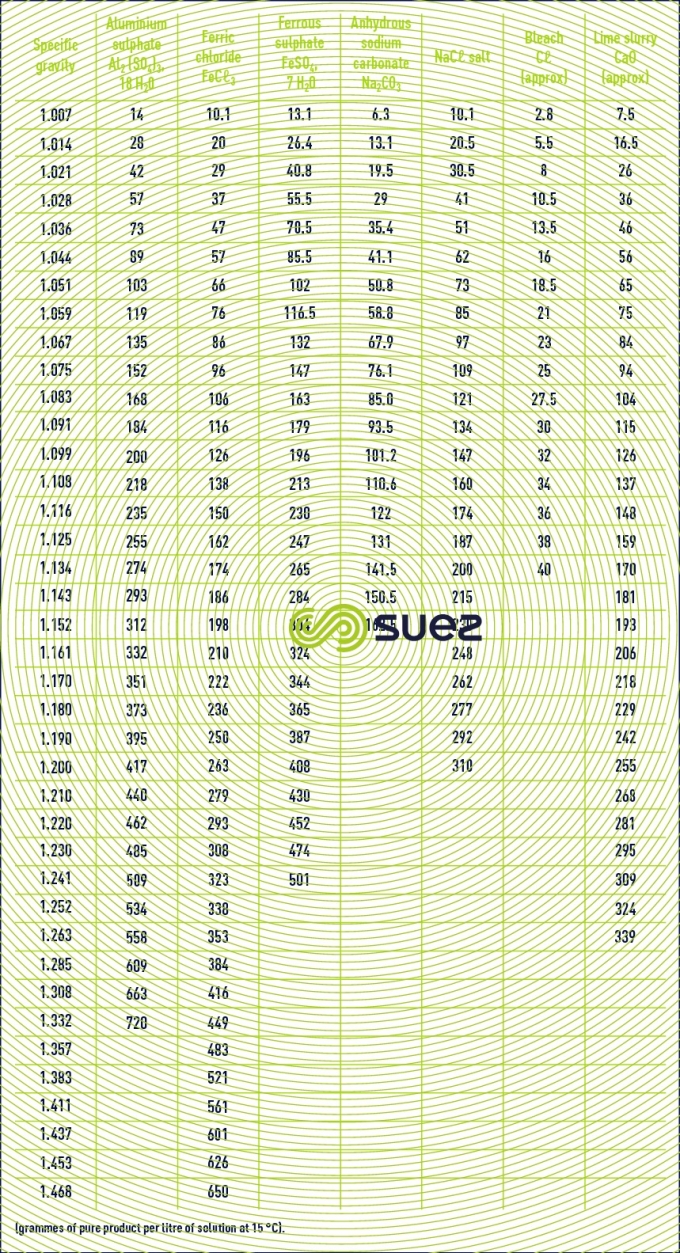
Note : the characteristic of bleach, the commercial designation for sodium hypochlorite, is its active chlorine content, evaluated in chlorometric degrees, 1° chlorometric = 3.17 g · L–1 active chlorine. 1 L of bleach at 18° Cℓ contains 57 g of active Cℓ2.1 L of bleach at 48° C` contains 152 g of active Cℓ2.
conductivity – resistivity
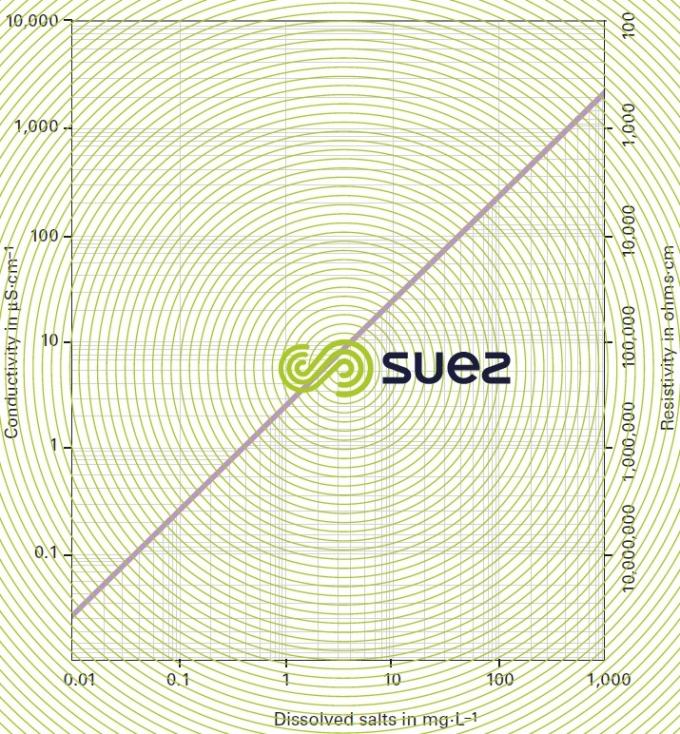
Conductivity is measured by the conductance of a water column positioned between two metal electrodes having a 1 cm2 area and separated from each other by 1 cm. Conductivity increases with the dissolved salts content and will fluctuate depending on temperature (figure 7). Conductivity is expressed in siemens per metre (S · m–1). The sub-multiple, microsiemens per cm (μS · cm–1) is the unit mostly used in water treatment.
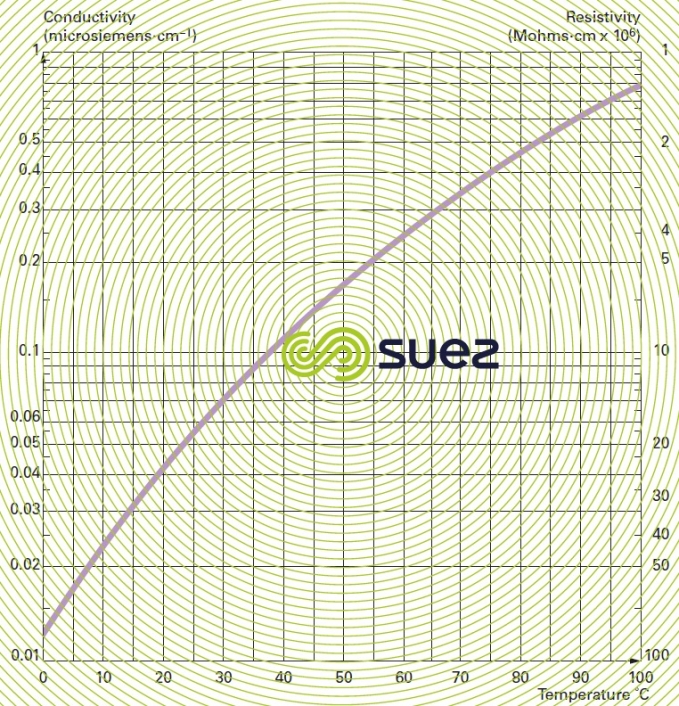
Resistivity is the opposite of conductivity and is measured in ohms·cm (Ω·cm). The relation between these two measurements is as following :


E.g. 10 μS · cm–1 conductivity corresponds to a 100,000 ohms · cm resistivity.
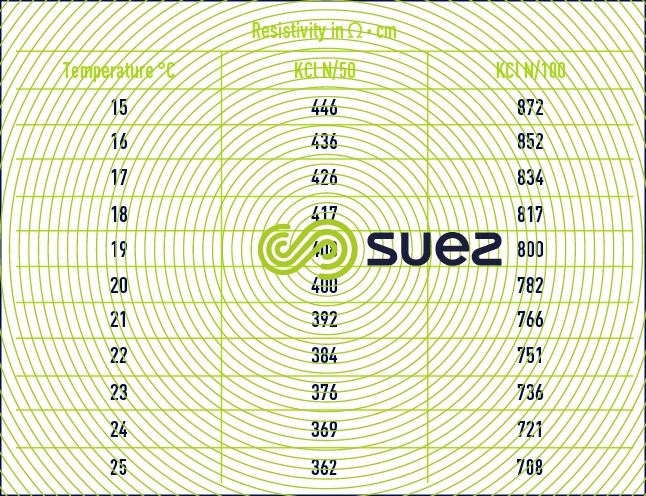
calibrating resistivity metres
Resistivity measurement cells have to be recalibrated at regular intervals using N/50 or N/100 potassium chloride solutions (table 26) :

relation with dissolved salts
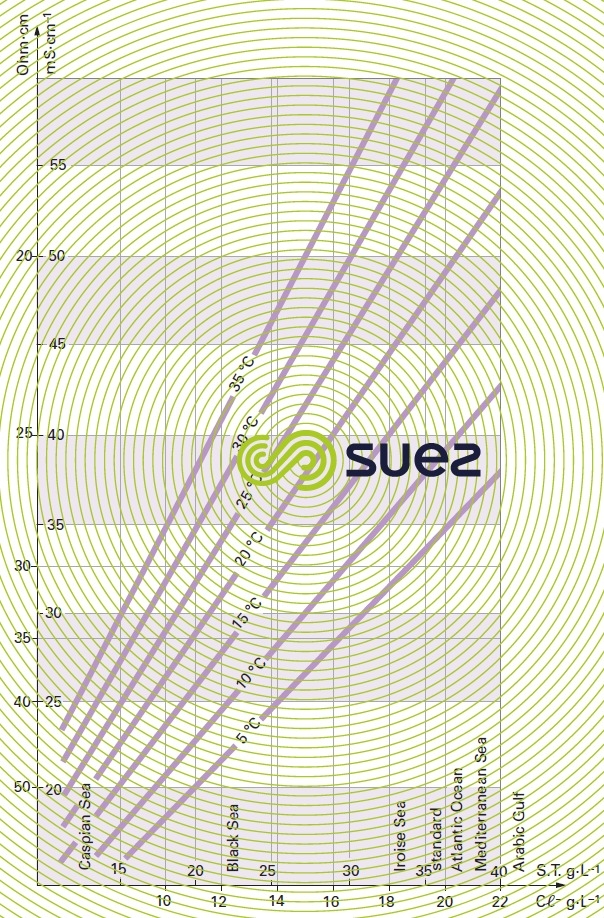
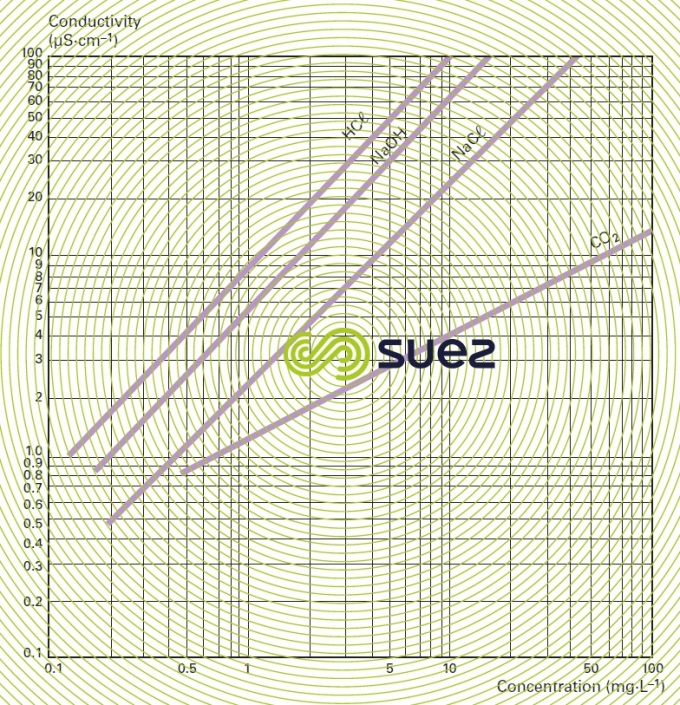
For each type of dissolved salt, there is an empirical relation between conductivity and salt concentration; for instance, for a 1 mg · L–1 concentration variation in a dilute solution, conductivity at 25°C can vary from 1.25 μS · cm–1 for a pure solution of calcium bicarbonate to 2.5 μS · cm–1 for a pure solution of sodium chloride (broken down into very mobile ions, figure 8), through 1.5 to 1.6 μS · cm–1 for natural freshwater where all the most common salts are represented; this principle also applies to seawater (figure 9). The relation between conductivity and concentration is even higher in a pure solution of acid or base (figure 10).
A measurement of conductivity variation (or resistivity) will therefore provide accurate information on changes in water salinity, even at very low concentrations (figure 11). Additionally, natural water can be classified according to their conductivity (e.g. low mineralisation of less than 200 μS · cm–1, average mineralization of between 200 and 600 200 μS · cm–1, high mineralisation above 600 200 μS · cm–1).
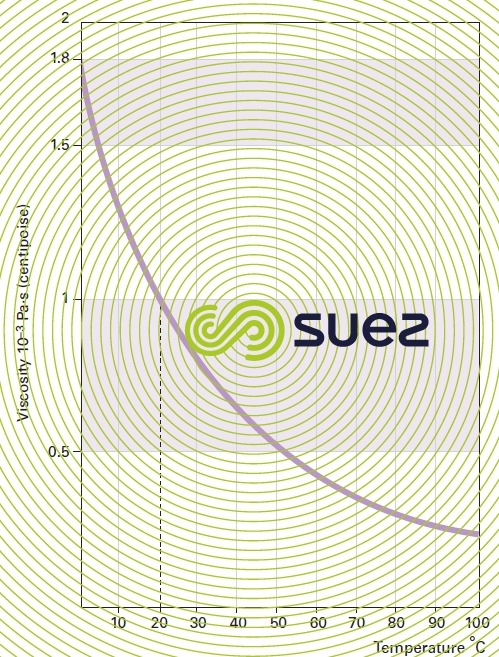
liquids viscosity
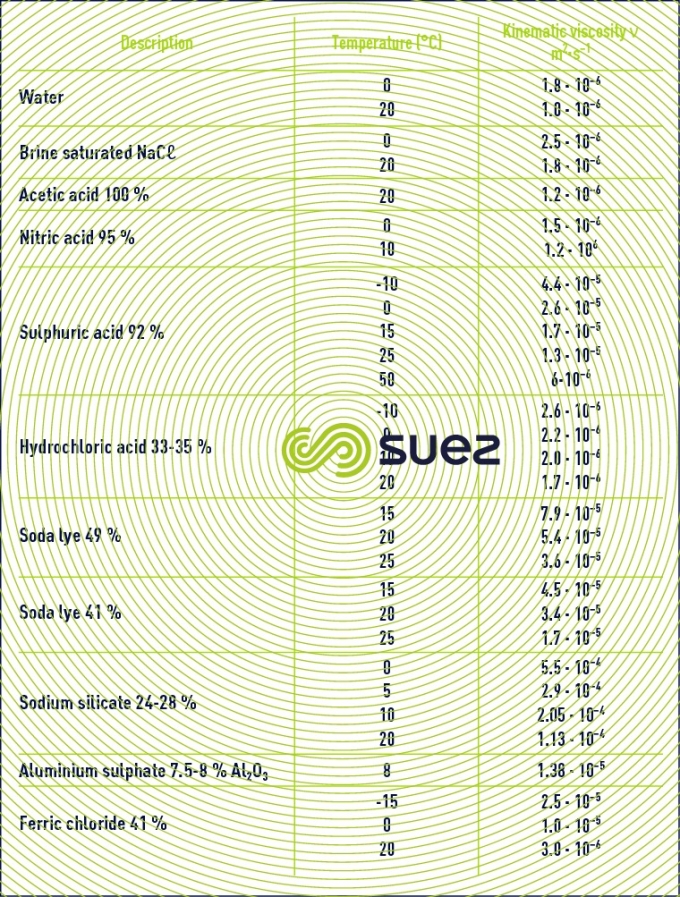
Note: some flocculation additives have a high viscosity and the supplier must be asked for details (see ain reagents used in water treatment).
unusual solutions
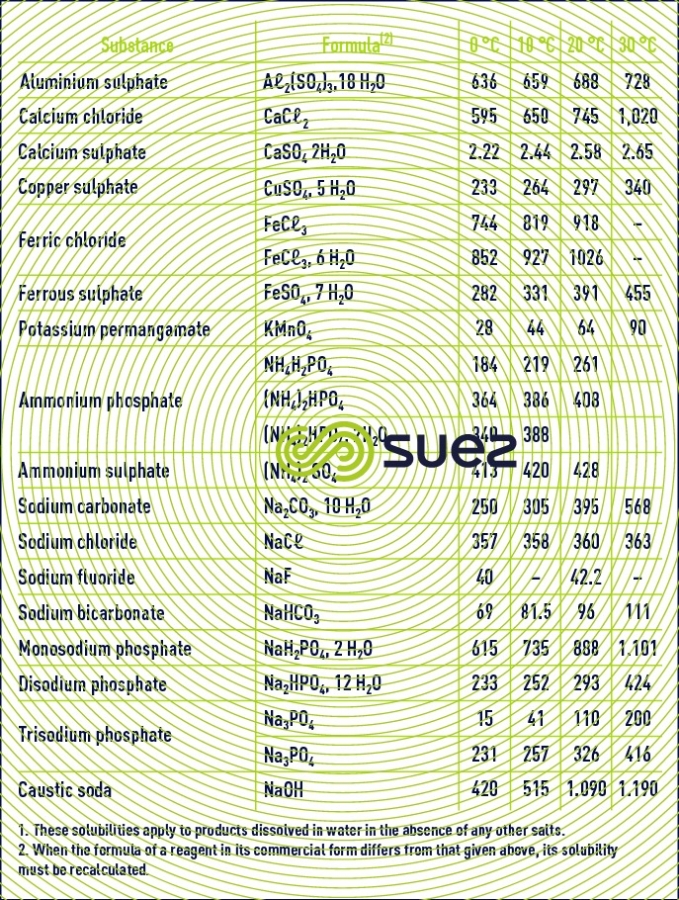
solubility
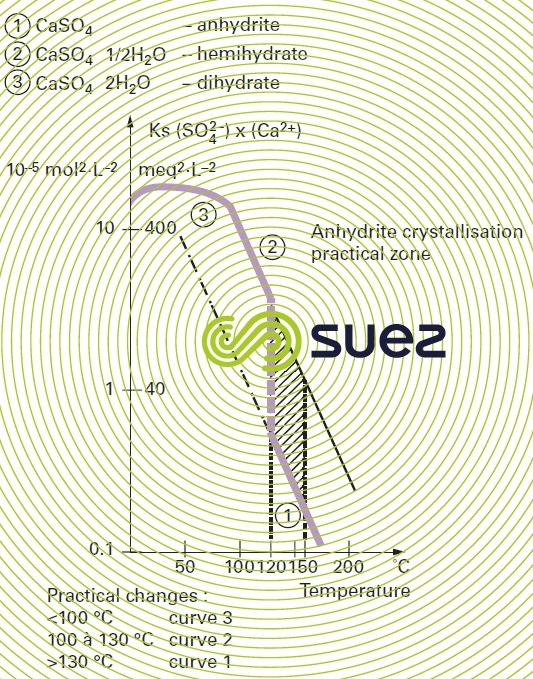
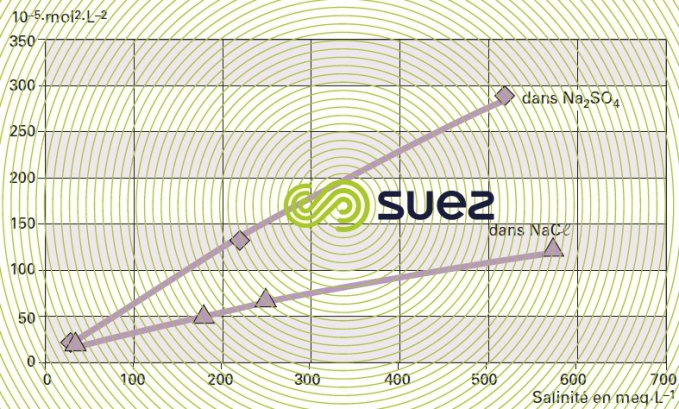
solubility of calcium sulphate (figures 13 and 14)
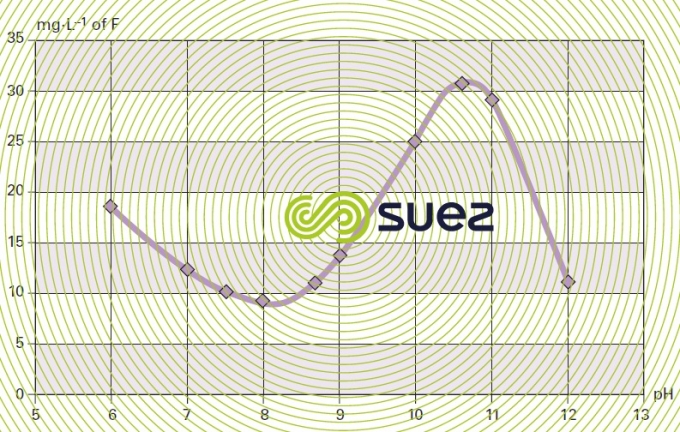
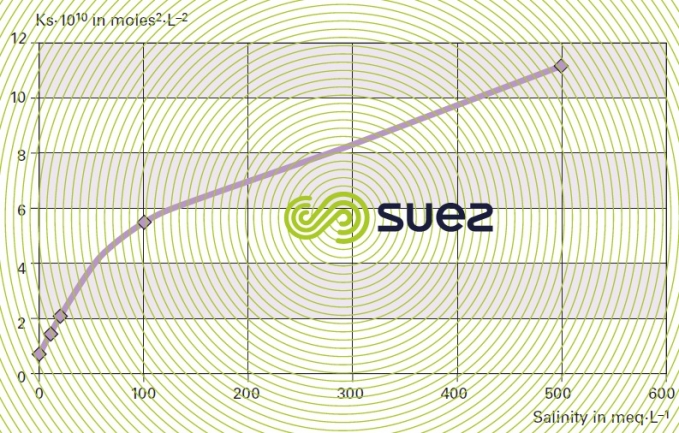
solubility of calcium fluoride (figures 15 and 16)
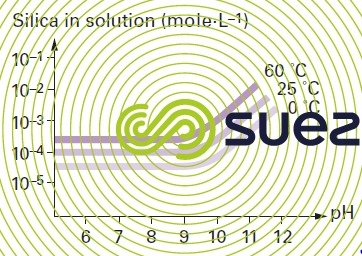
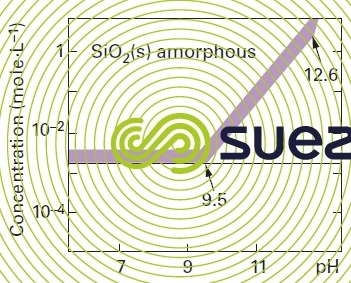
solubility of silica
Note : in the absence of polymerisation inhibitors : the presence of a salt also has an effect on the solubility of silica, Ca2+ et Mg2+ will particularly reduce this solubility significantly.
Note : quartz (the solubility of the natural crystalline form of silica) and of amorphous silica in water will vary with pH and with temperature. Silica solubilises as silicic acid H4SiO4. In an aqueous solution quartz is less soluble than amorphous silica.
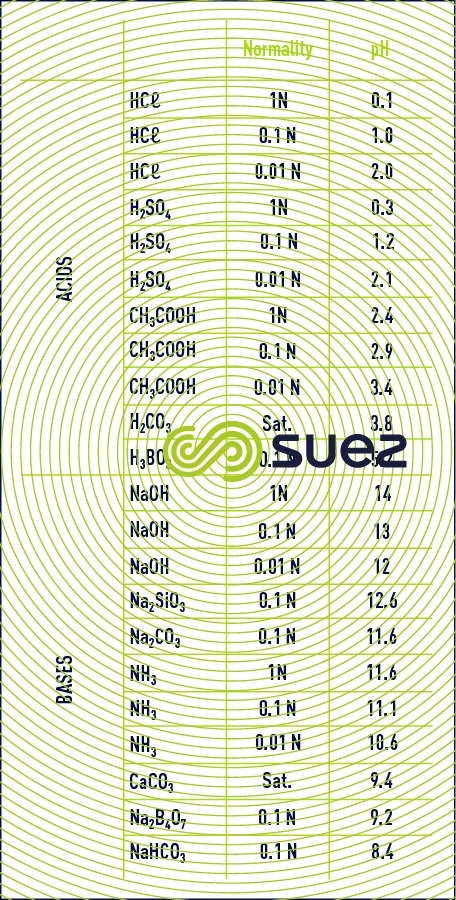
approximate pH values for pure solutions
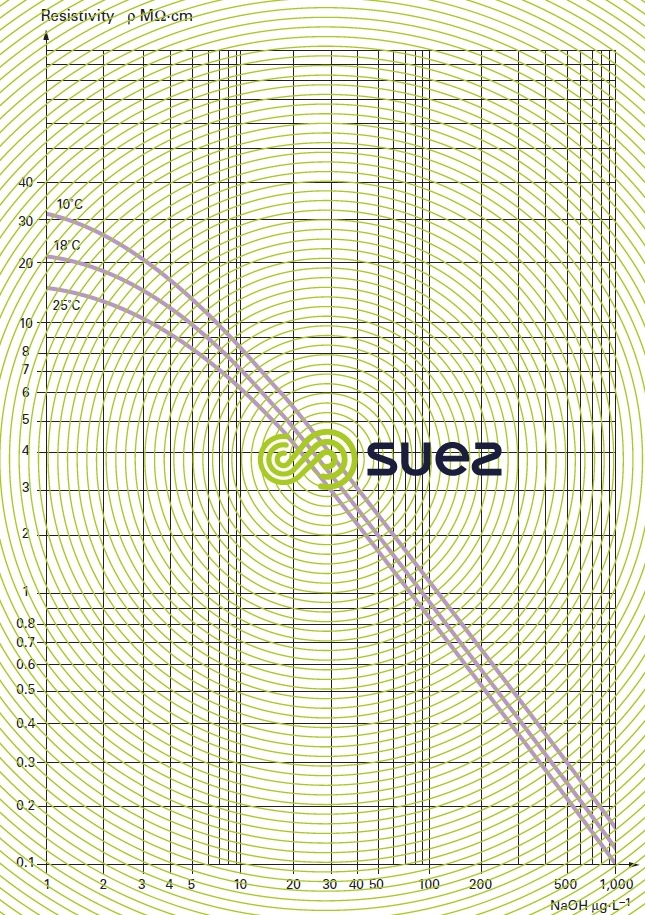
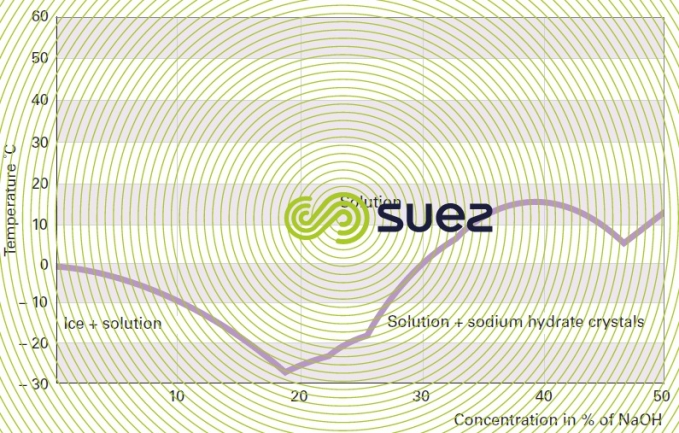
sodium hydroxide solution (table 31, figures 19 and 20)
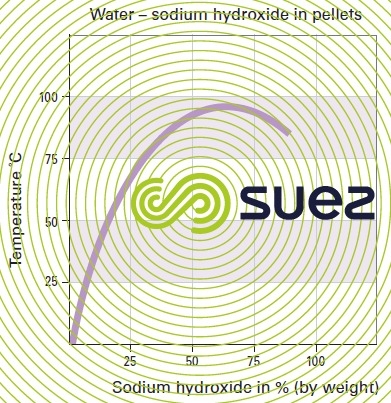
Dissolution reactions are highly exothermic.
sulphuric acid solutions (table 32, figure 21)
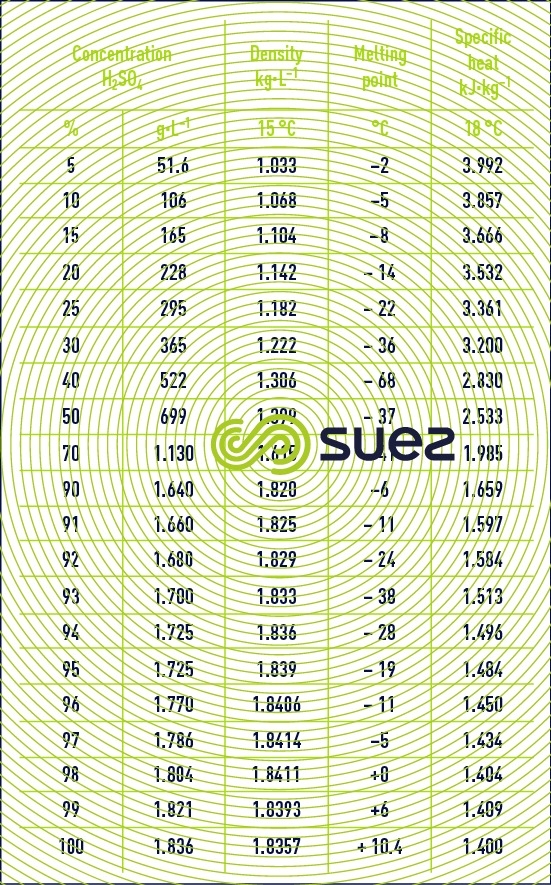
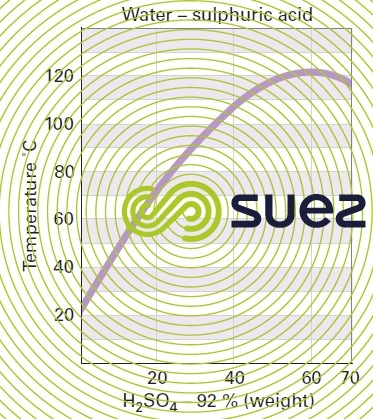
Dissolution reactions are highly exothermic. Care is required when mixing: always pour the acid into the water and not vice-versa.
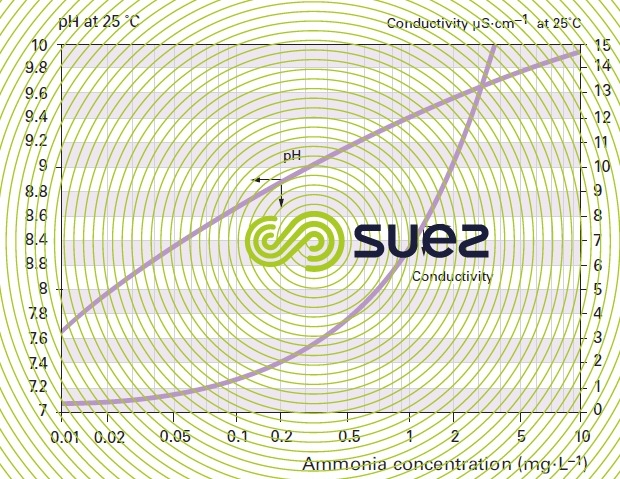
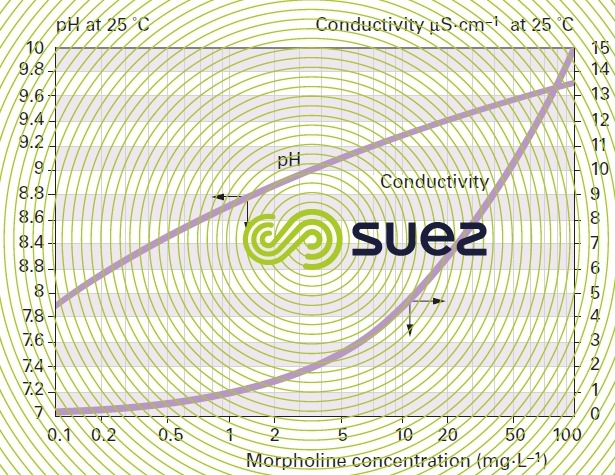
solutions of ammonia and morpholine (figures 22 and 23)
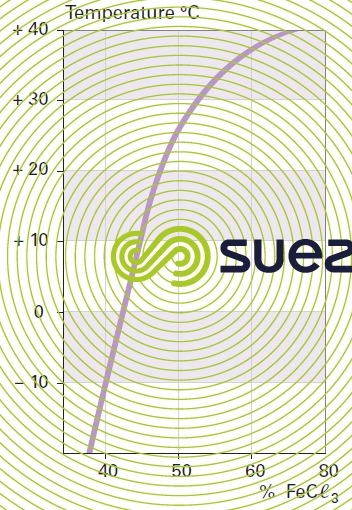
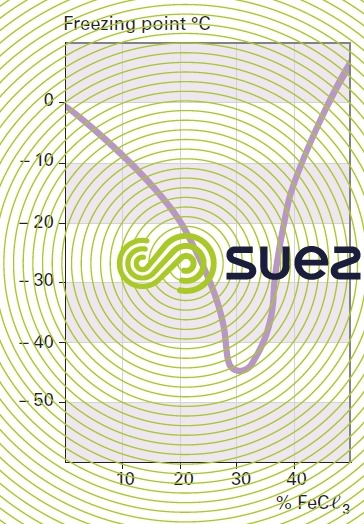
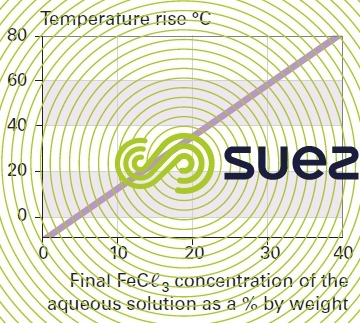
solution of iron chloride (figures 24, 25, and 26)
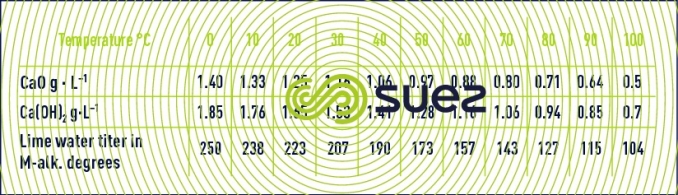
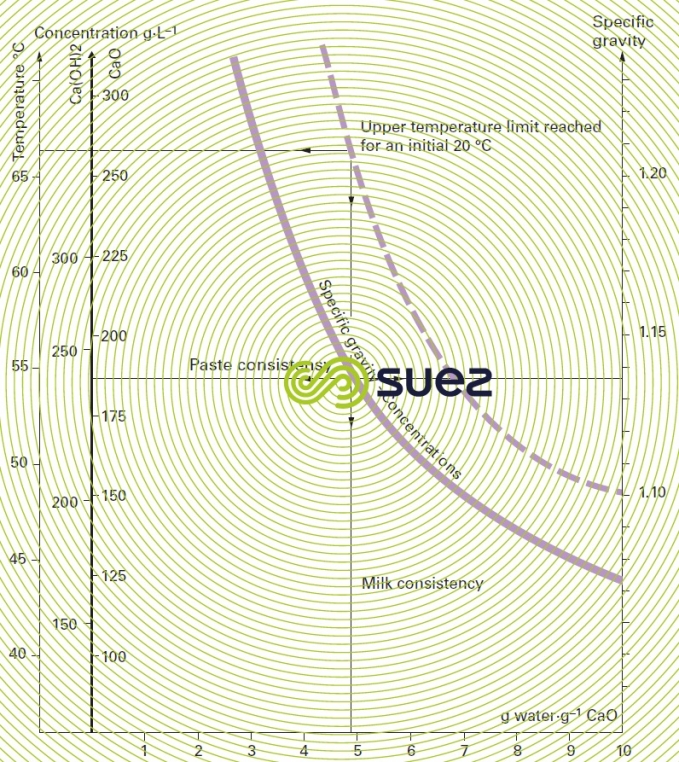
quick lime
Figure 27 gives :
- temperature rise;
- respective concentrations in g·L–1 CaO or Ca(OH)2;
- specific gravity,
based on the grammes of water per gramme of CaO dilution when quick lime slaking .
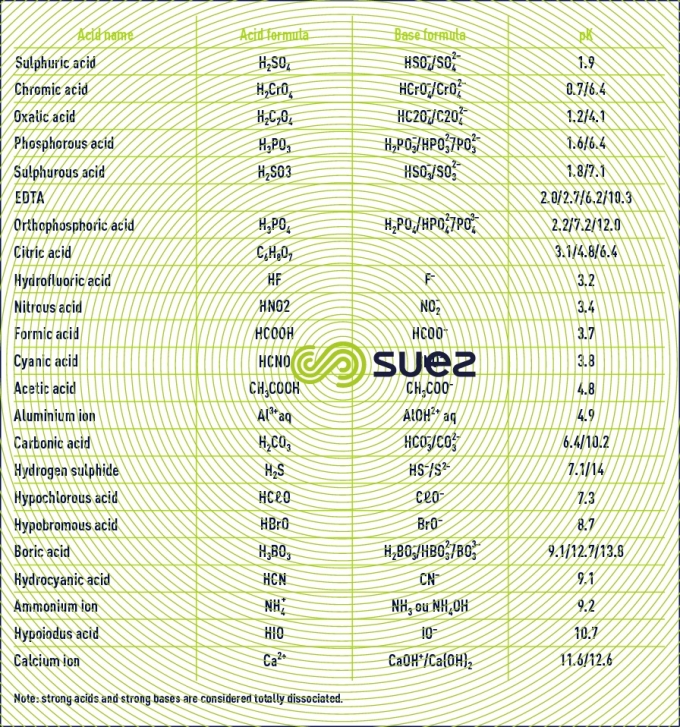
pK table
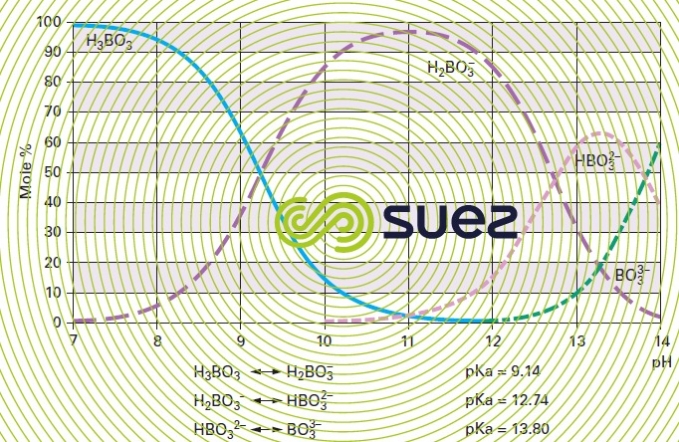
E.g. disintegration of boron (figure 28) :
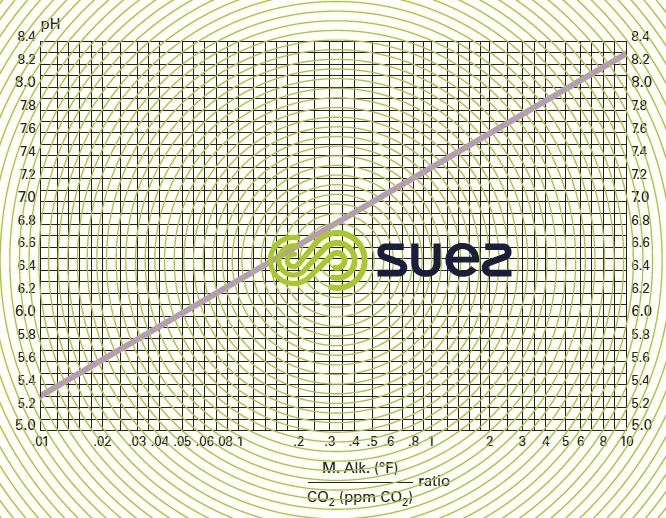
pH TAC ratio, free CO2 (figure 29)
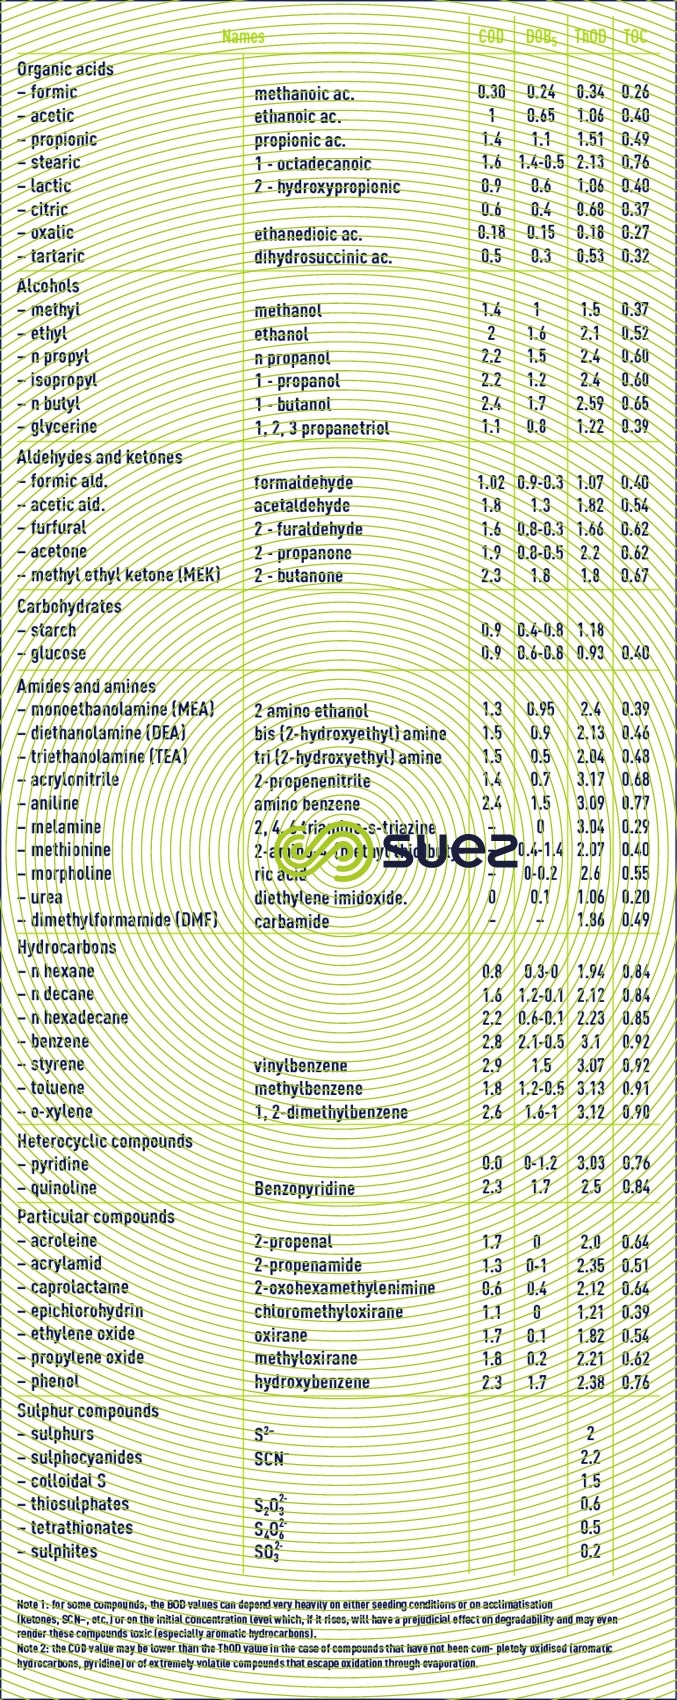
COD - BOD5 – TThOD equivalences of some organic compounds in g per g of compound (table 34)
Bookmark tool
Click on the bookmark tool, highlight the last read paragraph to continue your reading later
