


discharge of opening and short tubes
Reading time:


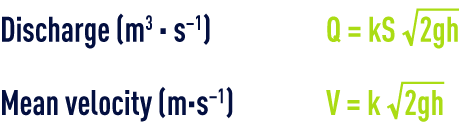
Where :
S = area of the opening measured at its extreme outer section (in m2),
G = gravity acceleration 9.81 m·s–2,
h = pressure head on the opening measured from the upstream level of liquid to the centre of gravity of the opening (in m).
The relation k = K–1/2 exists between the coefficient k used here and the coefficient K defined under minor losses in the pipelines, fittings, valves… for water.
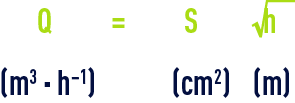
simplified formula for k = 0.62 :
Pilot tube
This method for measuring flow rates is often used each time the construction or the installation of a system reducing pressure is problematic. For measurements carried out in the pipeline, the curved end of the Pitot tube used to read pressure is generally positioned along the pipeline axis.

The differential pressure hc obtained represents the difference between static pressure and total pressure and, therefore the true dynamic pressure at the pressure indicating device. If Vc is the instantaneous flow velocity along the axis, in m · s–1 and Vm the mean flow velocity, in m · s–1 through the diameter D section, in m, for the flow rate Q in m3·s–1 of a fluid having a density expressedin kg · m–3, the value of the differential pressure expressed in mm of water column is:
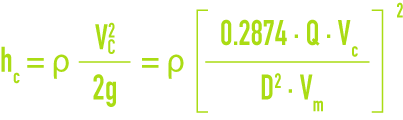
where the density under absolute temperature conditions T and absolute flow pressure P can be deduced from ρ0 under normal conditions using the following equation :
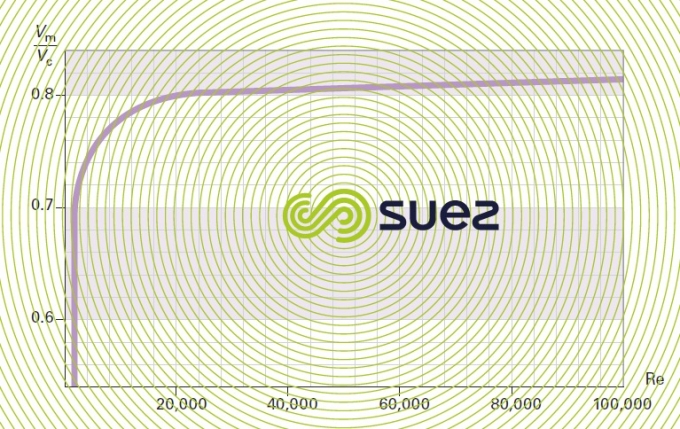
When flow is distributed symmetrically through the section due to sufficient straight lengths, the diagram shown in figure 41 provides the values for Vm/Vc according to the Reynolds number Re .
For low Re values, a mean velocity must be looked for by displacing the Pitot tube in the flow section.
Bookmark tool
Click on the bookmark tool, highlight the last read paragraph to continue your reading later
