


sizing principles
Reading time:A UV reactor is characterised by its head loss and by the dose that it is likely to deliver under a given flow rate.
The following head loss must be accounted for :
- head loss through all the modules or reactors as measured during hydraulics testing;
- head loss created by the level control for open systems (fixed or moving weir);
- if applicable, head loss created by a stilling plate upstream of the modules or reactors.
The UV dose delivered by the reactor can be obtained via 3 approaches: by average or discrete calculations and via Bioassay.
average calculation of the UV dose
The UV dose is expressed as the product of a UV intensity by a contact time. Although this is a simple approach when dealing with one single UV source and micro-organisms that are standstill, it is far more complicated for reactors equipped with several UV sources and having a dynamic behavior. Lamp aging properties (operating lifetime, number of on/off cycles) need to be accounted for in the calculations.
The average dose delivered by the disinfection system is expressed as follows:


lamp life-end factor Fp
The output emitted by a lamp declines with increasing operating hours. This phenomenon results from the oxidation of the impurities contained in the lamp quartz bulb and from depletion of the electrodes. The lamp aging factor is equal to the ratio of the UV output after N hours of operation to the UV output measuredafter 100 hours of operation. The value of the end of life coefficient Fp indicates the time when aged lamps need to be replaced in a reactor. The Fp coefficient varies between 0.65 and 1.
average intensity of a reactor, calculating I av
The average intensity delivered by a reactor is obtained from a calculation that takes the following elements into consideration: reactor dimensions, lamp number and output, distance separating the lamps, diameter and nature of the quartz sleeves and, finally, water transmittance. This average intensity can be calculated for various wavelengths, thus accurately incorporating lamp and water properties (case of medium pressure lamps).
hydraulic contact time t
This is the theoretical contact time during which a micro-organism is exposed to ultraviolet radiation. It is equal to the volume of the reactor(s) divided by the hydraulic flow rate.
hydraulic factors u/t and Fh
The q/t factor is the ratio between the actual contact time as measured from tracer test to the theoretical contact time. This factor characterises the plug-flow behavior of the reactor(s). Its value varies from 0.85 to 1.
The Fh factor takes the radial mixing inside the reactor into consideration. Significant radial mixing allows the micro-organisms to change their “irradiance level”, thus increasing reactor effectiveness. Its value varies from 0.5 to 1.
fouling factor Ft
The fouling factor reflects of the effect caused by elements that deposit on the surface of the lamp quartz sleeves. The main fouling compounds involved are grease, calcium or metal salts. Fouling becomes more noticeable as the lamp operating temperature rises. Fouling can be minimised through the use of a cleaning system. The cleaning frequency remains specific to an application. The fouling factor Ft varies from 0.5 to 0.9.
discrete calculation of the UV dose
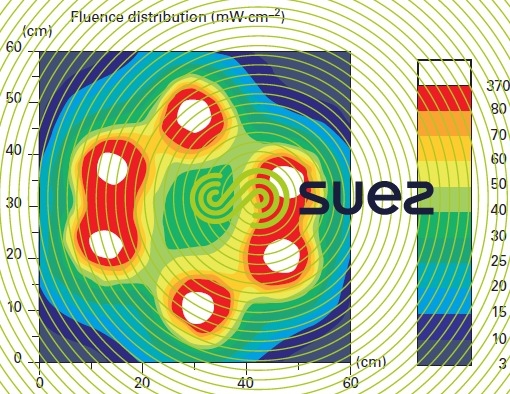
The The dose delivered by a reactor can also be calculated from matching a UV intensity field (distribution of UVC flux inside a reactor) with micro-organism trajectories passing through the reactor. UV intensity field calculations take into account the lamp output, its wavelength spectrum, quartz sleeve and water absorbance (figure 36). Hydraulic modeling is used to determine the microorganism trajectories. This modeling also provides information on the velocityfield present within the reactor (figure 37). The dose received by a micro-organismis obtained by summing the infinitesimal doses received along its trajectory. When several micro-organisms are considered in the modeling procedure a dose distribution is obtained, which is thereafter used in combination with a micro-organism inactivation curve to establish reactor performance (figure 33).


using the bioassay
The Bioassay results can also be used to size a UV disinfection system. For this purpose, it should be expressed as follows:

and this for one or more test micro-organisms.
Bookmark tool
Click on the bookmark tool, highlight the last read paragraph to continue your reading later
