


numerical characterisation of filterability
Reading time:specific resistance to r filtration
This is the resistance opposed to filtration (or to the outflow of the filtrate) by a quantity of cake deposited on 1 m² of filter surface area and containing 1 kg. of dry solids.
After several realistic simplification hypotheses (negligible resistance of the filter medium compared to cake resistance r and replacing the mass of suspended solids deposited per unit of filtrate volume by C, sludge suspended solids concentration), the specific resistance to pressure P (rp) is calculated as follows


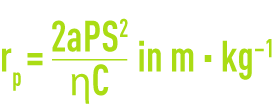
P = filtration pressure,
S = filter surface area,
C = sludge concentration (suspended solids) at the appliance’s intake,
h = filtrate dynamic viscosity,
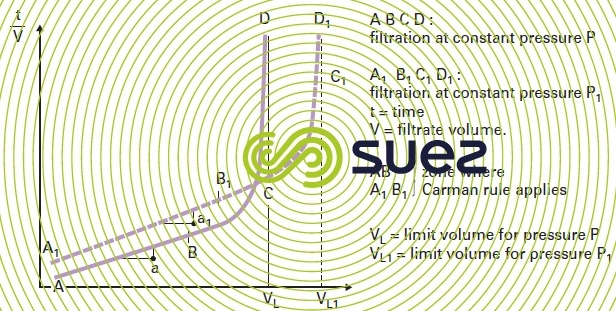
a = gradient of the straight line produced by the filterability test (figure 38 and filtrability test).

It is customary to raise comparisons between the various sludges using r0.5 (filtration coefficient at a 0.5 bar or 49 kPa differential pressure).
The value for r0.5 in mixed UWW sludge will be approximately 1014 to 1015 m · kg–1, a figure that is incompatible with direct passage through a filter press. Therefore, with this type of sludge, we will need to use a conditioning product, see sludge conditioning, to lower r 0.5 to below 1012 m · kg–1, this value producing acceptable filtration and, therefore, a dewatered cake.
On the other hand, in the case of carbonate removal sludge that is far more hydrophobic and crystalline, or sludge that has undergone heat treatment (see dynamic thickening), initial r0.5 figures will be very low (1011 to 5 × 10¹¹ m · kg–1) and no additive will be needed before the sludge is fed into the filter press.
compressibility factor (voir filtrability test)
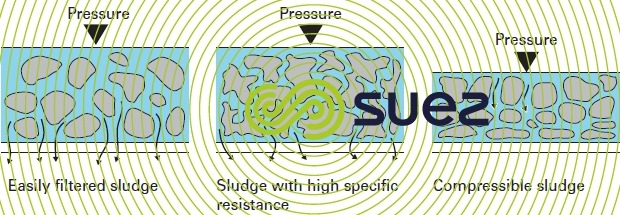
When the differential pressure rises, the cake pores tighten, resulting in increased resistance to filtration:

The value for S, the compressibility factor, is graphically defined by the gradient of straight line log rP = f (log P) (see CST (Capillary Suction Time) test figure 22) and this factor affects filtration flow.
If S < 0.7:sludge will not be very compressible and the filtration output rises as P increases (case of hydrophobic and crystalline sludges such as carbonate or calcium sulphate sludge, iron oxides, gas washing sludge…).Therefore, the use of high pressures will be very profitable in such cases.
If 0.7 < S < 1:sludge will be more compressible. The benefits of high pressures (12-15 bar) remain, especially if we want to obtain higher dry solids contents (e.g. case of sewage sludge that has undergone good mineral conditioning).
If S > 1: we can manage with 7 bar because no increase in pressure will produce any improvements in terms of the cycle or of final dry solids content (case of very problematic sludge such as hydroxides that have not undergone sufficient lime treatment, for instance).
Figure 39 is a schematic representation of this compressibility.
Note: with sewage sludge that has been treated using polymer, after drainage, S will be higher than 1. However, we will still be using high pressures (15 bar) in order to improve the cake/belt interface and to facilitate cake release (a cake that is less sticky).
limit dry solids content (see determination of limit dry solids content)
The filterability test (figure 32) enables us to measure a sludge’s asymptotic dryness limit under a range of pressures. During normal operation, it is not cost-effective to attempt to reach this value because the conditioning levels and cycle times will then be too high.
However, the dryness limit value is an interesting comparison factor that enables us to assess dewatering problems and to establish the performance limits applicable to the various dewatering appliances. This limit can only be exceeded by using thermal energy.
Bookmark tool
Click on the bookmark tool, highlight the last read paragraph to continue your reading later
