


different types of sedimentation
Reading time:There are various different types of sedimentation:
- granular particles will each settle separately and will each be subject to a constant settling speed;
- particles that are more or less flocculated will be of different sizes and, therefore, subject to variable sedimentation rates. At low concentration levels, the settling speed increases as the floc increases in size through collision with other particles; this is termed flocculant settling.
At higher concentration levels, the abundance of floc and its interactions will lead to an overall sedimentation which is most frequently characterised by a clearly defined interface between the sludge mass and the supernatant liquid: this is hindered settling where the rate will be optimum within a certain area of concentration, above which, we talk of hindered settling.
granular particle sedimentation
This is the simplest case and the only one that can be easily described by equations.
theory: fluid at rest
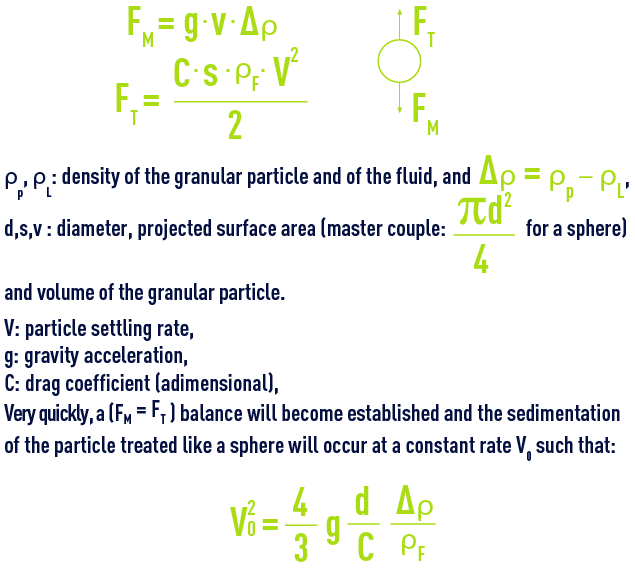
When a granular particle remains in a liquid at rest, it will be affected by a driving force FM (gravity minus the Archimedes thrust) and a resisting force FT (fluid drag) created by viscosity and inertia forces:


hydraulic conditions
The value of C, the drag coefficient, is defined by the disturbance which is in turn based on the settling speed. This disturbance is characterised by the Reynolds grain number established by:
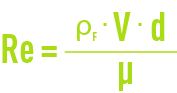
Re = adimensional.
where μ = dynamic viscosity.
When Re is low, the viscosity forces are far greater than the inertia forces. When Re is high, the viscosity forces are negligible.
The drag coefficient is provided by:

Table 9 provides the various values for a, n and C according to the Reynolds number.
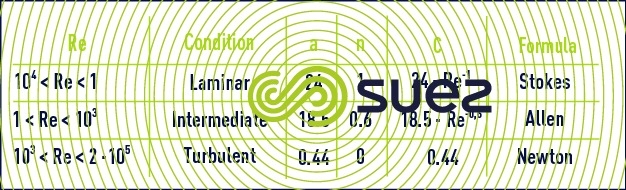

These formulas constitute the basis used for calculating grain movement in a fluid and are used for sedimentation (granular solids in a liquid, water drops in air), in upward motion (air bubbles in water, oil drops in water), for centrifugation, and for fluidisation.
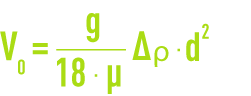
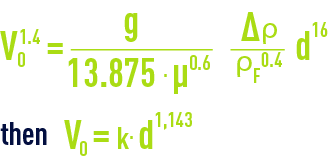
Under laminar conditions, the Stokes law applied to a spherical particle will give:
The aggregation phenomena that cause growth will, therefore, very rapidly increase the sedimentation rate.
Under transitory conditions, the Allen law also gives a rising rate based on particle size; however, this rate rises far more slowly because:
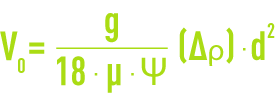
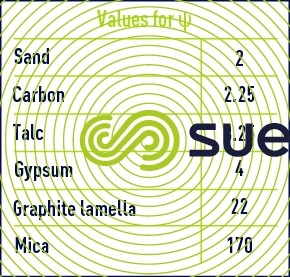
sphericity factor
This factor Ψ is provided by:
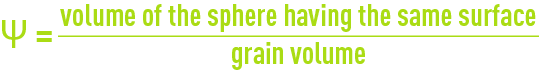
In the preceding operations, we then need to replace C by C' = ΨC and the Stokes law will be written:
et le tableau 10 illustrates the considerable effect this factor has on “flat” materials.
recovery conditions
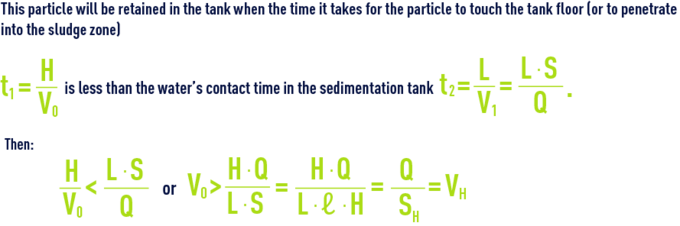
Let us consider a rectangular sedimentation tank that has a length L, a vertical section S = H·ℓ (where H is the water depth and ℓthe width) and a horizontal section SH = L· ℓ, evenly crossed by a throughput Q that either ascends vertically or travels horizontally; the following conditions will apply if the tank is to screen out a granular particle settling at a rate Vo in still water:
vertical upflow sedimentation
Particles having a sedimentation rate that is greater than the liquid’s upwards velocity will be screened out. This phenomenon is written:
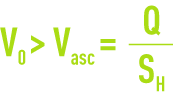
Q = liquid flow rate.
SH = settling tank free surface area.
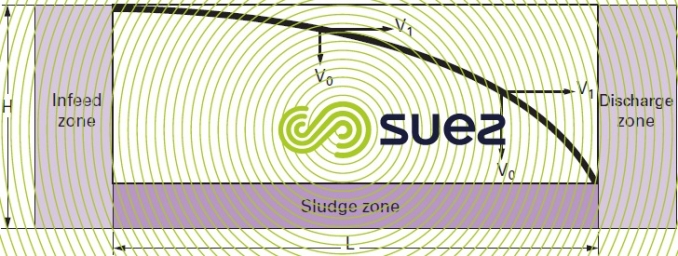
horizontal flow sedimentation (figure 11)
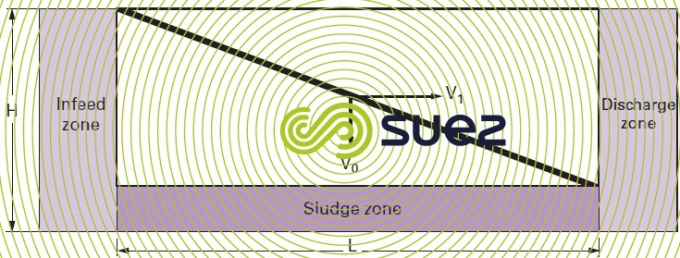
The velocity of a particle entering into the tank through the top will have two components:
V1: fluid horizontal velocity equal to Q/S.
V0: vertical settling speed provided by Stokes law.
VH:Hazen velocity (or hydraulic loading on the surface) similar to Vasc in the preceding example and expressed in m3 · (h·m2)–1 or m · h–1.
It should be noted that VH is independent of tank depth.
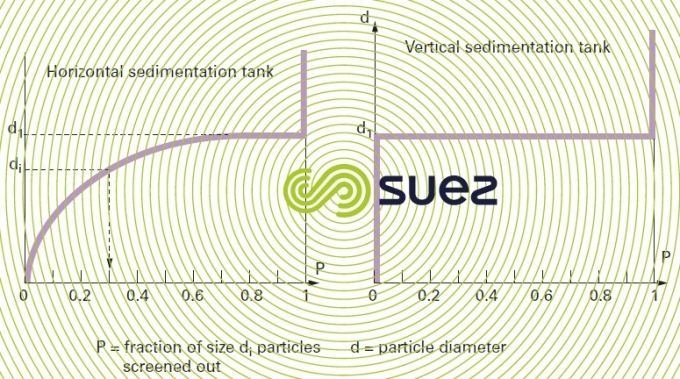
All particles having sedimentation rates above VH will, theoretically, be eliminated. However, if the water infeed is distributed over the entire depth of the tank, some of the particles that have a sedimentation rate V below the Hazen velocity will also be retained within the V/VH ratio whereas these particles would not have been retained in a upward flow sedimentation tank.
In theory, for identical horizontal surface areas, a horizontal flow sedimentation tank can thus be used to separate a greater number of particles (figure 12).
In practice, this difference will be attenuated and even reversed for the following reasons associated with horizontal flow sedimentation :
- hydraulic distribution problems in the vertical plane both at the inlet and at the outlet of a structure;
- sludge accumulation and collection, reducing the available section;
- in a circular, horizontal flow sedimentation tank, the horizontal component of the particle velocity (V1) decreases from the centre outwards and the particle will adopt a curvilinear trajectory
flocculant settling of flocculated particles
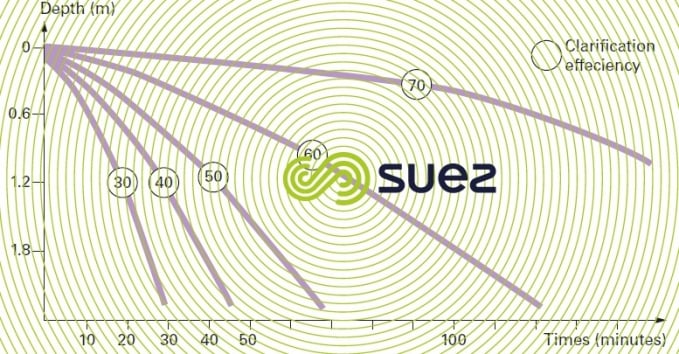
During sedimentation, flocculation will continue to take place and particle sedimentation rate Vo will rise (figure 13).
This process takes place as soon as flocculated matter concentration rises above approximately 50 mg · L–1.
Flocculant sedimentation effectiveness does not depend only on the hydraulic loading at the surface but also on contact time. There are no mathematical formulae available for calculating the sedimentation rate.
Only laboratory tests and graph methods can be used to ascertain this rate. Figure 14 provides the results of one such test.
hindered settling of flocculated particles
When the flocculated particle concentration increases, the interaction between particles can no longer be ignored; they undergo "hindered" settling. Initially, this may cause flocculation and sedimentation to improve (see sludge contact clarification) and then hindered beyond a certain critical concentration; we then talk of "hindered settling".
This is a phenomenon that is characteristic of activated sludge and flocculated suspensions when their concentration rises above approximately 500 mg · L–1.
visual observation
When hindered settling is carried out in a tube of adequate height and diameter (at least a 1-litre test tube), we normally see the appearance of four zones (figure 15).
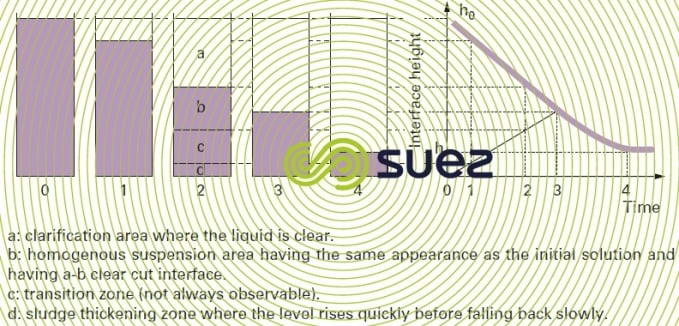
After a certain state, zones b and c disappear; this is the critical point. The change in the a-b interface height as a function of time constitutes the Kynch curve.
kynch curve (figure 16)
Kynch’s fundamental hypothesis is that the rate at which a particle falls depends exclusively on local particle concentration C Courbe de Kynch (figure 16).
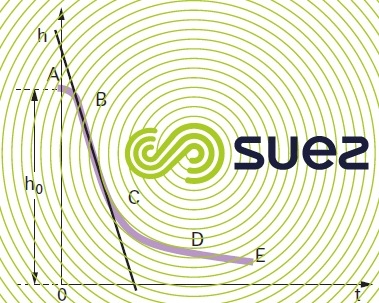
The separation surface between A and B is more or less clear-cut: this is the flake coalescence phase. This phase does not always exist.
From B to C, a rectilinear part identifies a constant settling speed V (straight line slope). In the case of a tube of specific dimensions, V depends on the initial suspended solids concentration and on the suspension’s flocculation properties. When the initial concentration C increases, the mass’s sedimentation rate V decreases: e.g. in activated urban sludge where the suspended solids concentration goes from 1 to 4 g · L–1, Vdecreases from 6 to 1.8 m · h–1.
The CD section which is concave at the top, refers to a gradual decrease in the settling speed of the deposit’s top layer.
From D, the flakes come into contact with each other and exert a compression effect on the lower layers.
Kynch’s theory applies to section BC and CD that cover the main flocculated sludge sedimentation area.
interpretation
Let us consider a suspension where its clarification does not include a coalescence phase (figure 17), calculations show that:
- in the BOC triangle, concentration and settling speed remain constant and equal to the initial values found in B;
- in the COD triangle, the equal concentration curves are straight lines that cross through the origin; this means that, as soon as sedimentation commences, the layers that are the closest to the base of the tank will have to transit through every concentration from initial concentration to that applicable at point D, the start of compression.
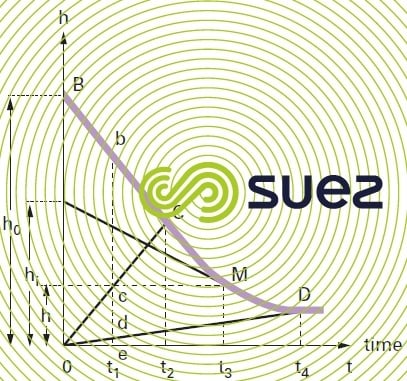
Consequently, the sludge medium that has a height eb at point in time t1 will have three separate zones:
- an upper zone bc where settling speed and concentration remain uniform and will have retained their initial values V0 and C;
- an intermediate zone cd where concentration increases gradually from c to d and the settling speed drops accordingly;
- a lower zone where sludge flakes are subject to compression.
In the medium considered at a point in time t2, the upper zone disappears and, at point in time t4, only the lower zone remains.
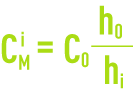
With regard to point M in section CD, there are two concentration levels:
CMi concentration at the interface,
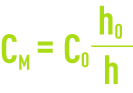
CM mean concentration.
According to the Kynch hypothesis:
Furthermore:
The three sections BC, CD and DE on the Kynch curve (figure 16) are used to dimension hindered settling tanks. The BC phase refers to the solids contact clarification area. The CD phase applies to structures where sludge concentration is targeted (units used for thickened sludge recirculation). The DE phase is used for sludge thickening.
mohlman Index (Sludge Volume Index: SVI)
One specific point needs to be considered on the Kynch curve, that of the 30 minute abscissa: the Mohlman index IM is widely used to define that clarification capacity of biological sludge and, therefore, for dimensioning its clarifier and even for initiating remedial action should bulking occur, see section biomass used in wastewater purification and chapter biological processes).
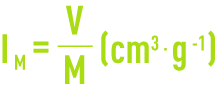
V: volume of sludge after 30 minute settling time (cm3),
M: suspended solids present in this volume (g).
The drawback of the Mohlman index is that it is heavily dependent on sludge initial concentration. Therefore, methods have been put forward for establishing an independent index for this concentration and which is, therefore, exclusively characteristic of the state of the sludge in the plant concerned. This is:
sludge index (IB) or diluted Mohlman index (DSVI).
The Kynch curve is plotted from dilutions used to achieve a volume of sludge equal to approximately 200-250 mL per L after 30 minutes of settling time. The sludge index IB used in France applies when this volume is between 100 and 300 mL; the DSVI used by the Anglo-Saxons applies when the volume is equal to between 150 and 250 mL. In both cases, it can be said that activated sludge has very good settling properties when its sludge index or its DSVI is between 50 and 100 cm3·g–1, normal settling properties between 100 and 200 and poor settling properties above 250.
Bookmark tool
Click on the bookmark tool, highlight the last read paragraph to continue your reading later
